
The MSG Global Instability Indices Product and its Use as a Nowcasting Tool
Marianne Koenig (EUMETSAT) and Estelle de Coning (South African Weather Service)
Weather and Forecasting, 2008, DOI: 10.1175/2008WAF2222141.1
ABSTRACT
The European geostationary Meteosat Second Generation satellite (MSG) offers a variety of channels to use for various purposes, including nowcasting of convection. A number of applications have also been developed to make use of these new capabilities for nowcasting, especially for the detection and prediction of severe weather. The MSG infrared channel selection makes it possible to assess the air stability in pre-convective, i.e. still cloud free, conditions. Instability indices are traditionally derived from radiosonde profiles. Such indices typically combine measures of the thermal and the moisture properties and often only use a small quantity of vertical profile parameters. MSG based temperature and moisture retrievals are used for the derivation of stability indices, which are a part of the MSG meteorological products derived centrally at EUMETSAT. Such indices are of highly empirical nature and are often only applicable to certain geographic regions, but they can assess the likelihood of convection within the next few hours. Numerous test cases and the more quantitative verification process that was initiated by the South African Weather Service show the generally good warning potential of the derived instability fields. The added capability of a continuous monitoring of the instability fields that is guaranteed by MSG’s 15 minute repeat cycle is most valuable, since it provides nowcasters with new information much more regularly than the twice-a-day soundings at only limited number of stations. The current EUMETSAT instability product is aimed at helping a forecaster to focus his attention to a certain region, which he can then monitor more closely with other means like satellite imagery and radar data over the next hours.
1. Introduction
Since 2002 EUMETSAT operates the advanced generation of geostationary imager, the SEVIRI (Spinning Enhanced Visible and Infrared Imager) instrument onboard the Meteosat Second Generation (MSG) satellites. Two of the MSG satellites have been launched since then, and are operated under their operational names Meteosat-8 and Meteosat-9. The SEVIRI instrument was specially designed to provide enhanced nowcasting information by scanning the Earth’s disk every 15 minutes in 11 spectral channels, an additional high resolution broadband visible channel is also available (Schmetz et al. 2002). The channel selection is based on the well-known AVHRR imagers of polar orbiters, together with additional channels to allow for the detection of specific surface, cloud, and atmospheric features, e.g. identification of fog, dust storms, fires, air masses, and cloud microphysical parameters. Table 1 gives a summary of the MSG channels.
| Channel | Centre (µm) | Range(µm) | |
| VIS0.6 | 0.635 | 0.56 – 0.71 | |
| VIS0.8 | 0.81 | 0.74 – 0.88 | |
| NIR1.6 | 1.6 | 1.50 – 1.78 | |
| IR3.9 | 3.92 | 3.48 – 4.36 | |
| WV6.2 | 6.25 | 5.35 – 7.15 | |
| WV7.3 | 7.35 | 6.85 – 7.85 | |
| IR8.7 | 8.70 | 8.30 – 9.10 | |
| IR9.7 | 9.66 | 9.38 – 9.94 | |
| IR10.8 | 10.8 | 9.80 – 11.80 | |
| IR12.0 | 12.0 | 11.00 – 13.00 | |
| IR13.4 | 13.4 | 12.40 – 14.40 | |
| HRV | 0.5 – 0.9 |
Table 1: MSG SEVIRI spectral channels
Since the launch of MSG, a number of applications have been developed to make use of these new capabilities for nowcasting, especially for the detection and prediction of severe weather. As a correct and timely prediction of convection processes, especially their severe stages, is an important area of nowcasting, many MSG-based observations of clouds and their temporal evolution have been used in both qualitative and quantitative aspects to identify the severest parts of a convective cloud system (e.g. Setvák and Rabin 2006, Rosenfeld and Lensky 2006) The MSG infrared channel selection, however, makes it also possible to assess the air stability in pre-convective, i.e. still cloud free, conditions. Air instability indices as single-valued numbers have a long history of evaluating the convective potential of the atmosphere. A comprehensive summary can be found in Peppler (1988). They are usually used such that some convective potential can be inferred if the respective index exceeds a certain threshold. Traditionally derived from radiosonde profiles, such indices typically combine measures of the thermal and the moisture properties and often only use a small quantity of vertical profile parameters. Due to the limited spectral resolution, MSG based temperature and moisture retrievals will only have coarse vertical resolution, which is, however, fully sufficient for the derivation of instability indices. It should be noted that such indices are of highly empirical nature and are often only applicable to certain geographic regions. Also, the above mentioned threshold criteria may change between regions and seasons. Such indices can only assess the likelihood of convection within the next few hours, and should still be seen in combination with other triggering lifting mechanisms.
A satellite derived map of instability parameters has the advantage of a very good spatial and temporal resolution which is a significant improvement over the sparse locations of radiosonde stations with at best two daily soundings.
In the following, we will first outline how the MSG based instability indices are derived, and the general performance of the results will be shown by a number of case studies. The last section will focus on a more dedicated validation study in terms of real warning potential, where the satellite indices are compared to a later occurrence of lightning as a signature of severe convection.
2. Theoretical Background
Atmospheric instability parameters are routinely extracted from the MSG imagery within the Meteorological Products Extraction Facility (MPEF) at EUMETSAT. Since these parameters are provided on a global scale (i.e. the entire MSG field of view), the product has been termed Global Instability Index (GII). From the algorithm side, the GII parameters can be produced on any spatial scale raging from a single MSG pixel and as averages over n x n pixels. The current operational setup is such that the product is derived as 15 x 15 pixel averages, i.e. over an area of approximately 50 x 50 km2. Some of the here presented case studies, however, come from an offline test environment, where 3 x 3 or 5 x 5 MSG pixel averages are computed.
Instability indices are usually calculated from atmospheric profiles of temperature and humidity to provide some information concerning the vertical stability of the atmosphere. Various indices are used by forecasters for different applications and regions, and these indices are defined as a difference of profile parameters in different pressure levels (e.g. Galway 1956, Kurz 1993). Such data are usually derived from radio soundings, but a few satellite derived indices also exist (e.g. derived from the GOES satellites, e.g. Hayden 1988, Rao and Fuelberg 1997). The air mass parameters can be used to issue severe weather warnings if the corresponding index exceeds a certain threshold. These thresholds are usually determined empirically and should not be regarded as fixed values – they may vary from season to season and from region to region. A skilled local forecaster is absolutely necessary for a correct interpretation of the provided indices.
The MPEF GII product includes two instability indices – the Lifted Index and the K-Index, which will be used in this study, as well as the total precipitable water content TPW as a further air mass analysis parameter. The instability indices are defined as:
| Lifted Index = T(500hPa) – T(near surface, lifted to 500hPa) |
| K-Index = [ T(850hPa) – T(500hPa) ] + TD(850hPa) – [ T(700hPa) – TD(700hPa) ] |
| TPW = Vertically integrated water vapor concentration |
(1), where:
T is the air temperature at the indicated levels,
TD the observed dew point temperature at the indicated levels
The atmospheric layer is potentially unstable for a negative Lifted Index, and a K-index more than 20 degrees Celsius is a good indicator of unstable conditions.An operational satellite based retrieval of the Lifted Index parameter and the Total Precipitable Water has been performed since 1988 using the GOES Atmospheric Sounder (VAS) instrument (Hayden 1988, Menzel et al. 1998). Studies have shown that the good spatial and temporal resolution of the VAS instrument and of the derived parameters give a good potential for the identification of preconvective conditions (Kitzmiller and McGovern 1989). For the VAS data, these results are presented in a pictorial form with color coded Lifted Index/precipitable water areas together with an overlay of the apparent cloud top temperature as provided by the IR10.8 channel. Animations of these images can be used to visually enhance the areas of high likelihood of strong convection and of cloud growth (http://cimss.ssec.wisc.edu/goes/rt/). The MPEF GII retrieval algorithm is in its theory very similar to the physical retrievals developed for the GOES Sounder instrument and only works for clear sky conditions, i.e. no instability information is inferred for cloudy pixels.
The GII retrieval is a “physical” method, i.e. it tries to infer an actual temperature and humidity profile from the satellite observed radiances in a given set of channels. The air mass parameters are then derived from this profile. Purely statistical methods exist, which use regression schemes between the satellite observations and the actual index, where the entire regression is based on some training data set as e.g. radio soundings. The results of such statistical methods are often of poorer quality and have a number of other disadvantages, as e.g. the total dependence on a given instrument and training data. The physical retrieval is often referred to as an optimal estimation or 1DVar type of retrieval. An inversion algorithm is applied to find an atmospheric profile which best reproduces the observations (Rodgers 1976, Hayden 1988, Ma et al. 1999). In general, this is a multi-solution problem – a wide range of temperature and moisture profiles may exist that produce identical satellite measurements in such limited number of spectral channels. A suitable “background” or “first guess” profile is used as a constraint to the solution. As this retrieval problem has an iterative solution, the first guess is fed to the iteration scheme as an initial proposal for a solution. The original first guess is then slowly modified in a controlled manner until its radiative properties (the simulated radiances at the top of the atmosphere for the MSG channels) fit the satellite observations. A typical first guess field is a short-term forecast. Major limitations of this method are the high computational effort and the fact that the retrieved profiles tend to retain features of the first guess.
The core of the retrieval is the standard retrieval equation (Ma et al. 1999, Rodgers 1976):
with:
x: observation vector (temperature and humidity profile)
n: iteration step, n=0 denotes first guess or background profile
TB: observed brightness temperature
TB,n: simulated brightness temperature for profile of iteration step n
Sx: covariance matrix of first guess errors
Kn: weighting function matrix (Jacobians)
Sε: error covariance matrix of observed brightness temperatures and of the radiation
In its application to the SEVIRI instrument onboard MSG, the physical retrieval uses six channels: the three window channels IR8.7, IR10.8, and IR12.0, the two water vapor channels WV6.2 and WV7.3, and the CO2 channel IR13.4. Accordingly, the matrix Sε contains the instrument’s temperature noise in these six channels with the uncertainty of the radiation model added.
The background profile is taken from the ECMWF (European Centre of Medium range Weather Forecast) global model forecasts, which are provided on a 1° latitude/longitude grid. The covariance matrix Sx was produced from a global set of atmospheric profiles (Chevallier 2002) to cover a wide range of natural variability. As the full range of natural variability would leave the retrieval problem too unconstrained, i.e. it would find highly unrealistic solutions, the original matrix Sx was downscaled to find a compromise between a realistic constraint and a possibility for the retrieval to find a different solution than the first guess.
The observation vector x contains the full vertical temperature and humidity profile and the surface skin temperature as the important lower boundary condition for the IR window channels. The radiation model RTTOV (Saunders et al. 1999) is used as it provides a computationally fast method to derive the Jacobians K. In addition, the forward model of RTTOV is used to derive the simulated MSG temperatures for a given observation vector – or profile – x. The iteration is stopped if the root mean square (RMS) difference between the observed and simulated brightness temperatures in the six channels is less than a given threshold, usually set to 1.5 K.
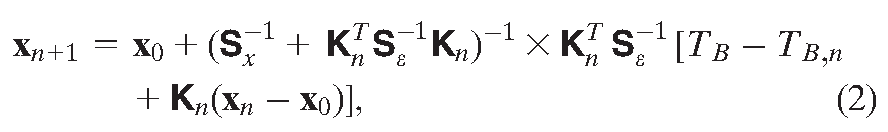
Fig. 1 shows a visualization of the operational product with its 15 x 15 MSG pixel resolution. The averaging process is here done on the brightness temperature level, i.e. every box enters the iteration scheme with the average brightness temperatures. The product is derived for every 15 minute MSG repeat cycle, for the full disk up to a satellite viewing angle of 70°. It should be noted that a GII value is assigned to a processing box if 50% or more of the box is cloud free, where the cloud information is taken from the MSG Cloud Mask product (Lutz 2007). The brightness temperatures are of course only averaged over the cloud free field of views.
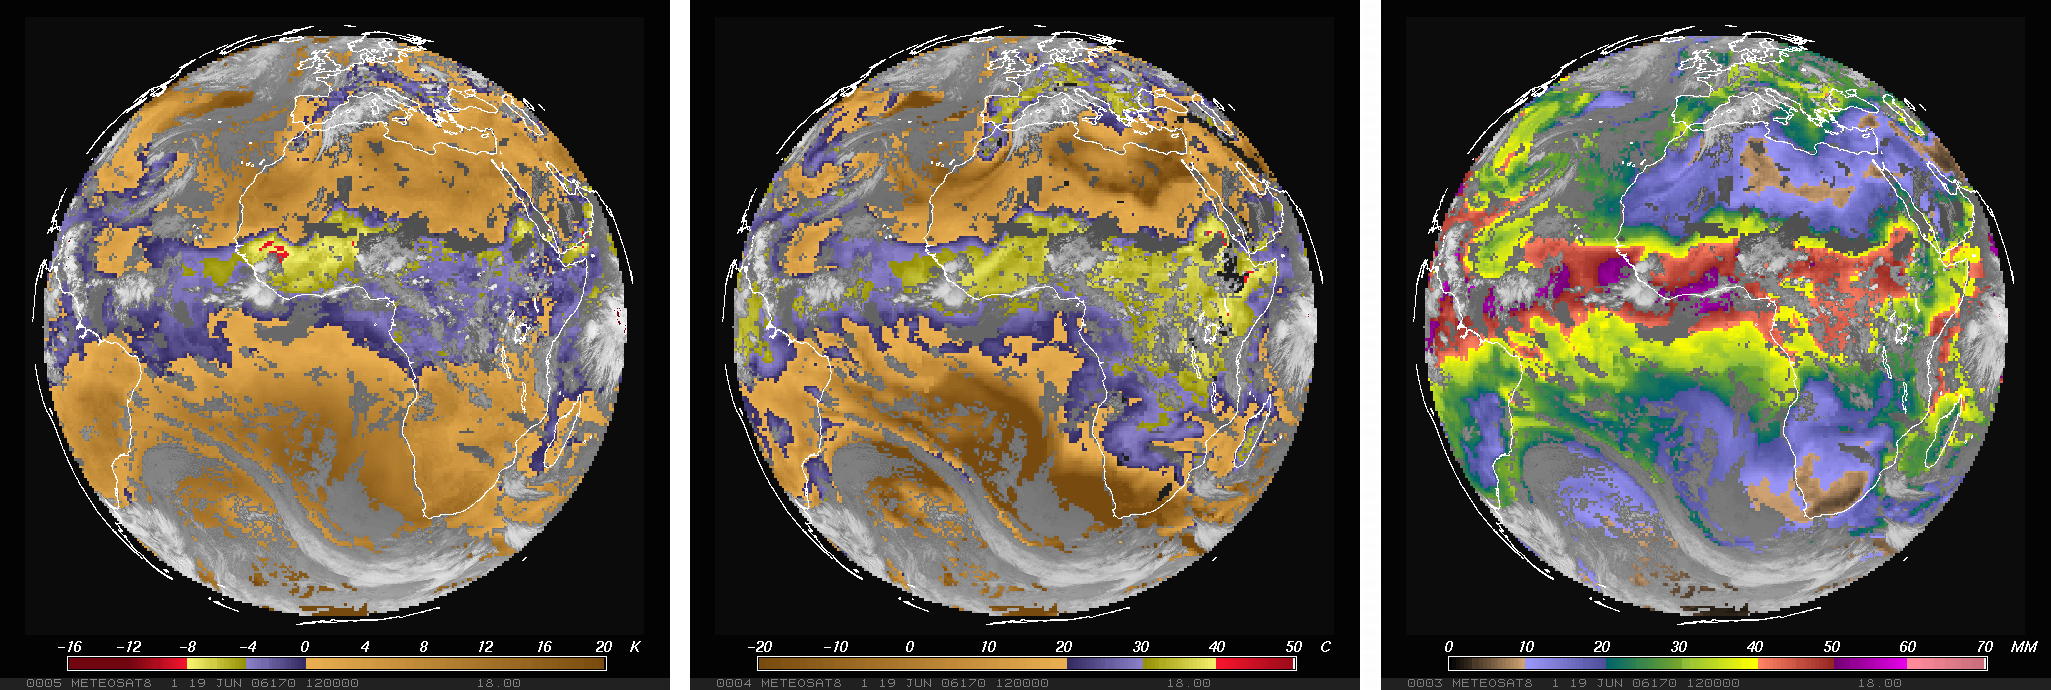
Fig. 1: Example of the Lifted Index (left), the K-Index (center) and the Total Precipitable Water (right)as provided by the operational GII product for the entire MSG coverage (example is for 19 June 2006, 1200 UTC). Detected clouds are overlaid in various grey scales to roughly indicate the cloud top temperature.
There are always a number of pixels or processing boxes within each image where the physical method never converges to a solution, i.e. where the final RMS difference against the observations is never reached. This usually occurs over clouds, where the entire scheme is not applicable and thus naturally does not find a good solution. In the MPEF installation, as mentioned above, the GII retrieval actually only runs on the cloud free pixels, and this information is taken from the MSG pixel-based cloud mask product. As a detail, it should be noted here that a GII processing element consisting of n x n MSG pixels is here considered as cloud free, if at least half of the n x n pixels are flagged as cloud free. The necessary brightness temperatures for the retrieval are then of course only averaged over the cloud free parts of the processing element. In principle, the GII can also run in a stand alone mode, without the underlying cloud mask, as the presence of clouds will immediately lead to a “failed” GII retrieval and is thus automatically masked out from the result. Fig. 2 shows an example of this stand-alone GII mode: On of the retrieved parameters (K-Index) is shown together with the infrared window channel (IR10.8) brightness temperatures for those areas where the retrieval never came to a good solution. The IR10.8 image is shown for reference as a visual comparison that indeed the retrieval failed over clouds, i.e. clouds are mostly also directly detected within the retrieval.A further important input parameter to the retrieval scheme is the correct knowledge of the spectral surface emissivity. This is especially important for the SEVIRI IR8.7 channel, which is centered at 8.7µm wavelength. Non-vegetated, desert type of surfaces have a rather low surface emissivity of 0.75 – 0.80 in this channel, and this needs to be accounted for within the retrieval’s radiation model. Fig. 3 shows an example of the total precipitable water product as one of the retrieval products. The left panel shows the retrieval results using a uniform spectral surface emissivity of 0.95 for all channels. Over most parts of the Saharan desert the retrieval could not find a suitable solution – in the visualization this is shown by the corresponding IR channel grey scale.
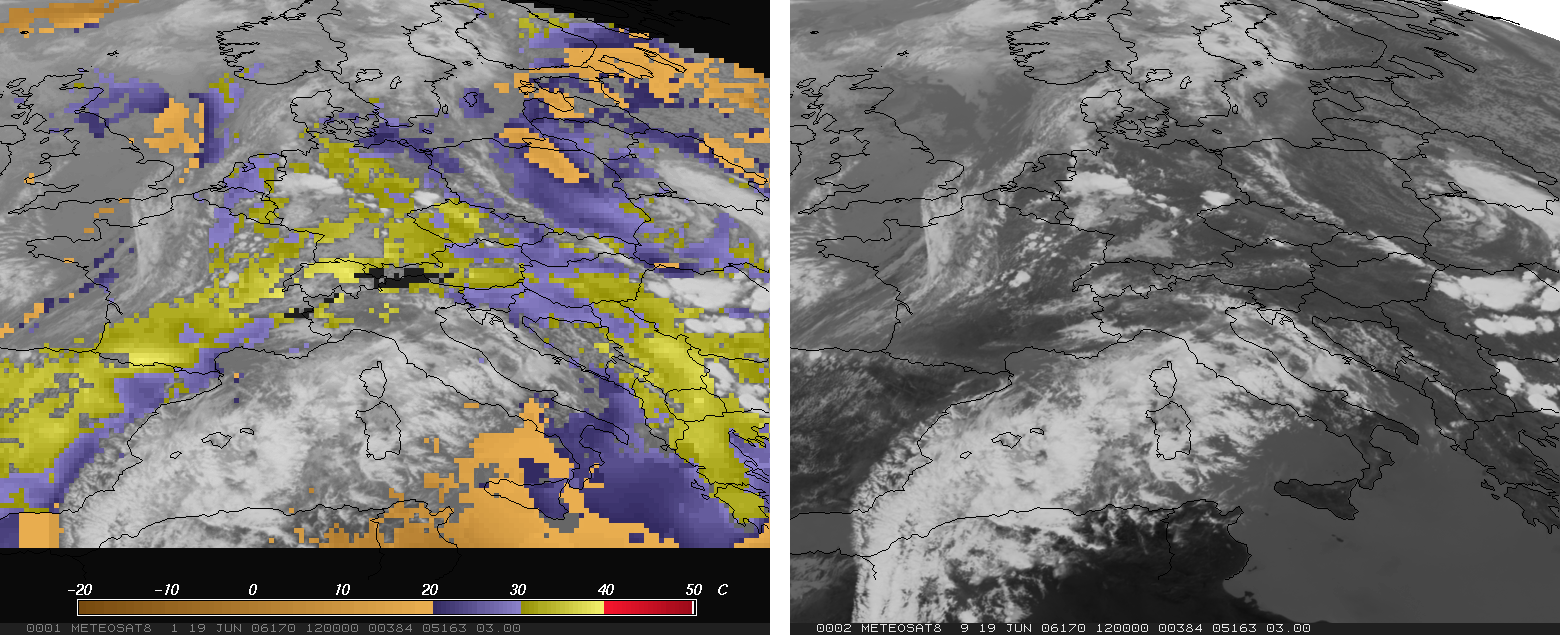
Fig. 2: K-Index example over Europe (left, using the algorithm inherent cloud detection. The MSG IR window channel (IR10.8) is shown on the right for reference. The retrieval results are here for 5 x 5 MSG pixels boxes.
Fig. 3: Retrieved product coverage (here for Total Precipitable Water as an example) for a uniform spectral emissivity (left) and for the spectral emissivities taken from the IREMIS database (right). Note the bad coverage, i.e. non-successful retrievals, over the large desert areas. (Example is for 03 October 2007, 0600 UTC, box size is 15 x 15 MSG pixels))
However, using the spectral emissivities from the IREMIS database http://cimss.ssec.wisc.edu/iremis/, Seeman et al. 2007), which are remapped to the MSG pixel locations, resolves this problem, as the right panel of Fig. 3 shows.
As mentioned before, a typical feature of such an inversion scheme is its dependence on the first guess field and the fact that the retrieved profiles tend to retain the general characteristics of the first guess profiles. In many cases, the first guess already matches the observations so closely that the profile is not changed at all, i.e. the RMS to the first guess field is already below 1.5 K. However, there are always cases where the first guess field is quite significantly changed within the retrieval, i.e. the satellite actually adds information. This added information often modifies extreme values and local gradients. Fig. 4 shows an example: The ECMWF 12-hour forecast is used as the first guess for the retrieval. The forecast K-Index already shows a zone of moderate instability over Germany, extending to the South East over Austria and neighboring countries. In the retrieval, this zone is not only slightly enhanced in values, but also significantly shifted towards the East. This is actually supported by local radio soundings, as summarized in Table 2.
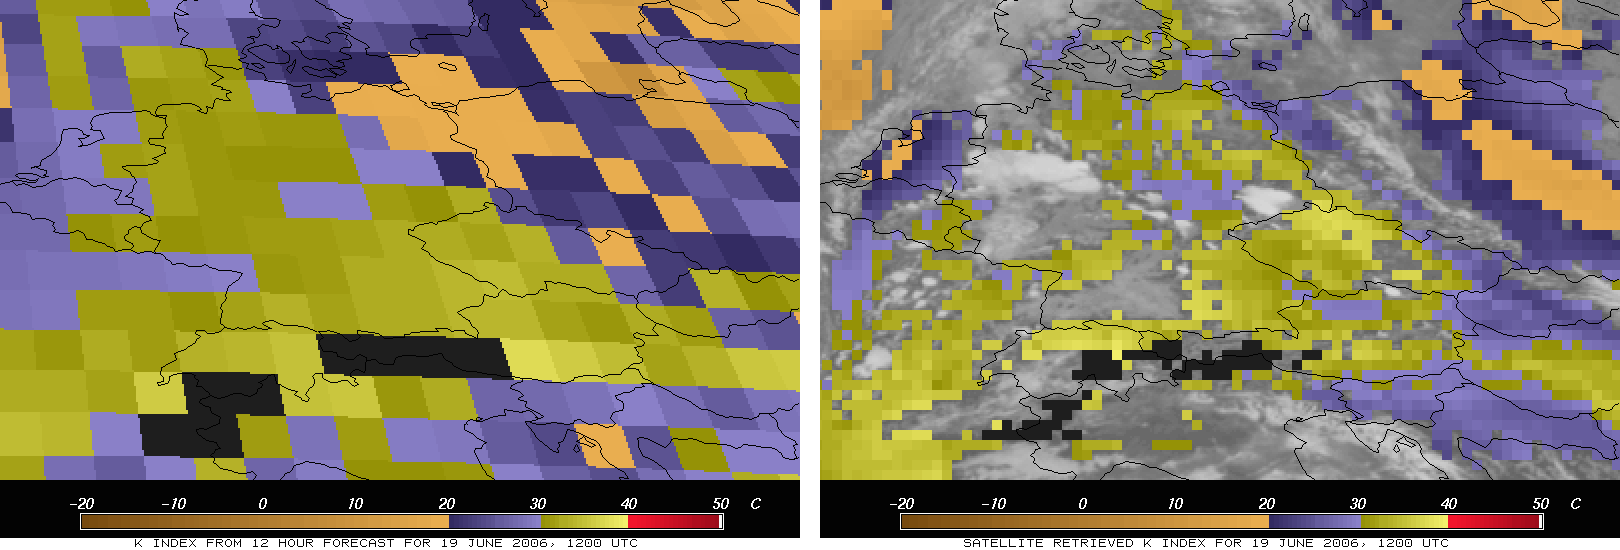
Fig 4: Forecasted K-Index, on a 1° x 1° latitude/longitude grid, for a case over Central Europe on 19 June 2006, 1200 UTC (left), and the retrieved K-Index which used this forecast as the first guess (right)
|
Radiosonde Station Radiosonde
|
K-Index
|
K-Index from 12-hour forecast
|
K-Index from satellite retrieval
|
|
Lindenberg (52.2 N, 14.1E)
|
31.4 °C
|
19.5°C
|
33.0 °C
|
|
Wroclaw (51.1N, 16.9E)
|
26.9 °C
|
21.0 °C
|
25.7 °C
|
|
Legionowo (52.4N, 21 E)
|
11.8 °C
|
21.5
|
15.0 °C
|
Table 2: Some local radiosonde observations together with the forecasted and the satellite derived KIndex.
Radiosonde locations are all in the area of interest in the Eastern part of Germany and Poland. Fig. 5 shows the typical behavior of the retrieval scheme, in terms of how many iterations of equation (2) it takes before a good match with the satellite observation is reached. The area of high K-Index changes with respect to the forecast over Eastern Germany and Poland is well dominated by orange, i.e. several iterations were needed here to change the not so appropriate first guess to the final result.
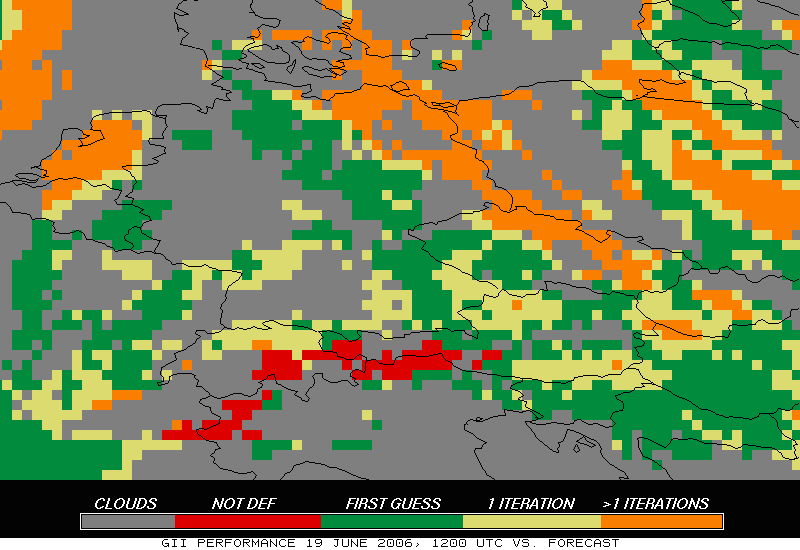
Fig 5: Internal diagnostics of the retrieval case shown in Fig. 4: For the non-cloudy non-grey) areas, the Fig. depicts where the retrieval simply reproduced the first guess 12-hour forecast (green), where 1 iteration of Equ.(2) was needed (yellow), and where more iterations were needed (orange). Red are the high elevation areas where the K-Index is undefined.
3. GII Applications
The following section 3.1 will show a few examples of the GII results, which demonstrate the area of application and possible operational usage. We will focus on a case of high instability, which was in this case a good predictor for strong convection that happened later, and we will also show an example that the GII results correctly identify very stable air masses. Section 3.2 will then highlight a special application and verification environment that was set up during the convective season in summer 2006/2007 in South Africa,.
3.1. GII Examples for some Test Cases
Fig. 6 shows the K-Index result from the operational MPEF dissemination for 26 October 2006, 0800 UTC. Each box in this visualization represents a color coded view of the operational 15 x 15 MSG pixel average values together with the precise K-Index value written in the box (Malan and Kroese 2006). Again, cloudy areas are shaded according to the corresponding IR10.8 image to give some visual impression of the cloud situation.
Usually K-index values exceeding 30 degrees Celsius are indicative of strong convection potential, and K > 40 degrees Celsius mark a close to 100% chance of convective storm occurrence (Peppler, 1988). In this case, K-index values of around 40 °C were reached just east of the Pretoria/Johannesburg region (in red), where a few hours later a very severe storm occurred (Fig. 7).
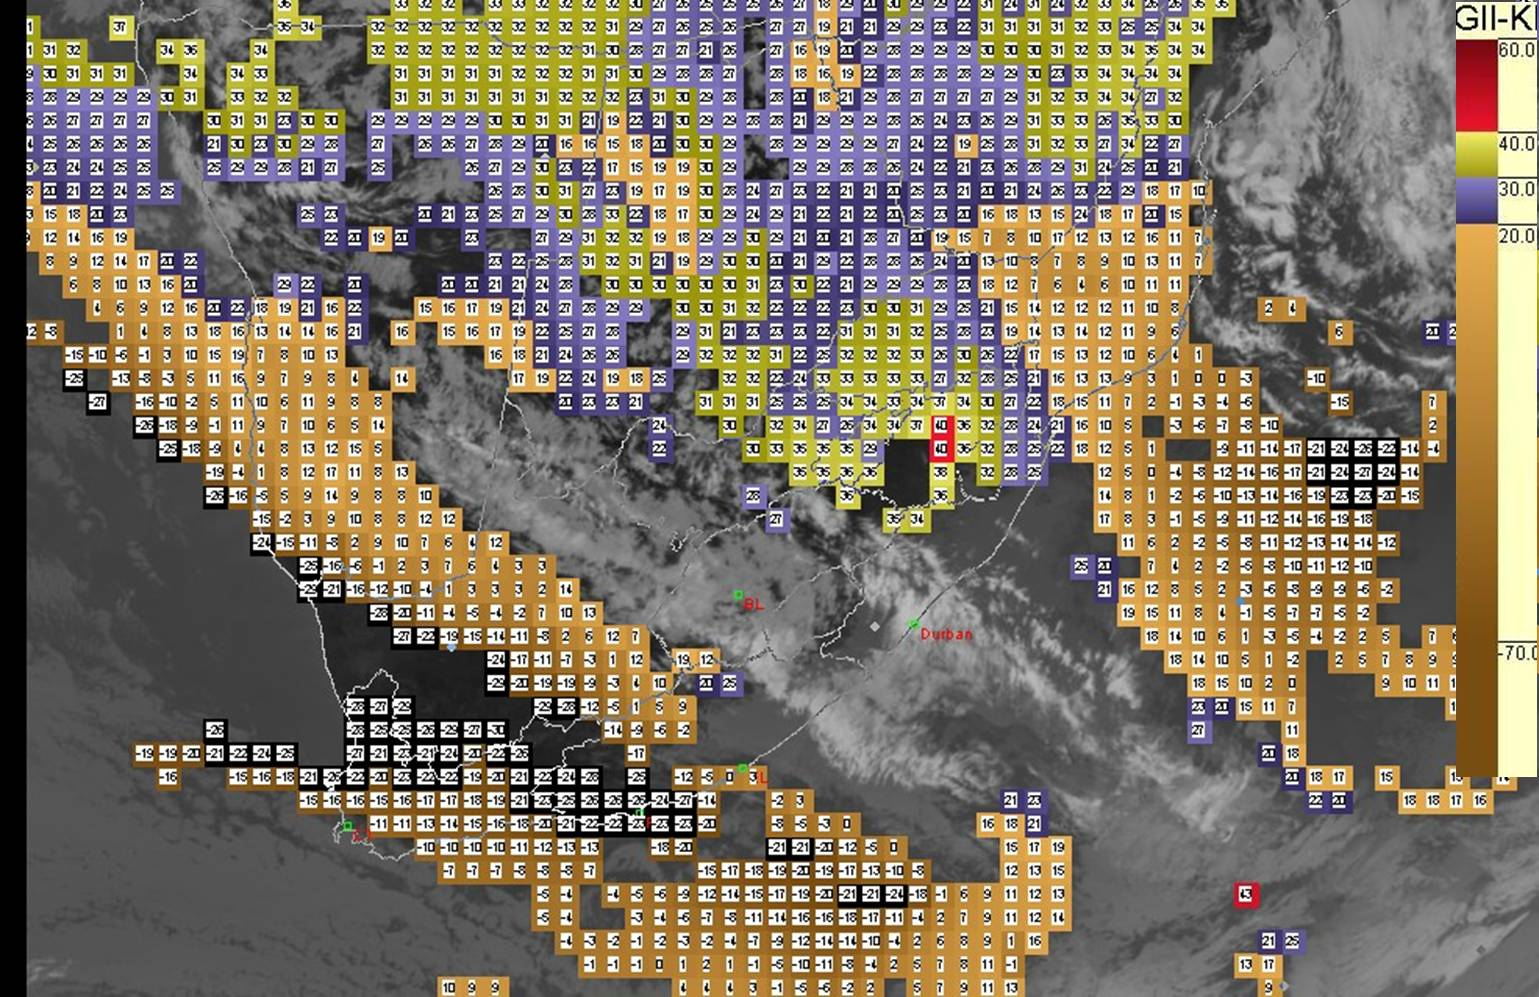
Fig. 6: K-Index (values of increasing instability are shown in blue to yellow to red) over South Africa, for 26 October 2006, 0800 UTC. This product actually shows the operational GII product which was locally received and processed in South Africa. Each box is the average over 15 x 15 MSG pixels. (Picture courtesy of South African Weather Service, SUMO)
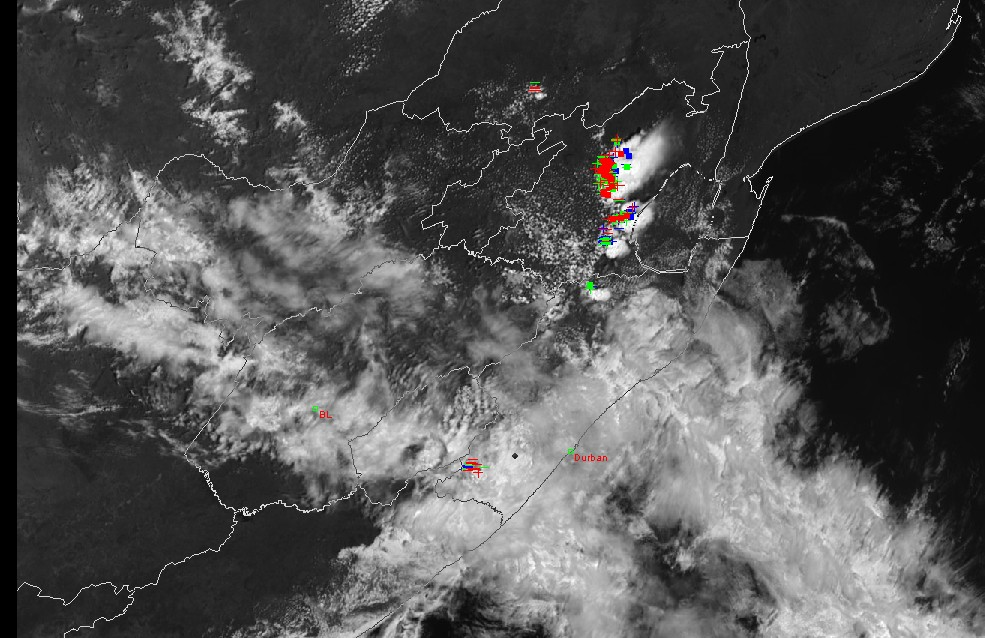
Fig. 7: Image of the MSG high resolution VIS channel for 26 October 2006, 1030 UTC: A strong storm has developed over the area of the previously high (close to 40 °C) K values. Lightning reports are overlaid. The display of the satellite image and lightning overlay is updated every 15 minutes as the satellite image updates. The lightning strokes on the display are either “-” or “+” signs, indicating the polarity of the stroke. Very thick “+” or “-” symbols indicate strokes in excess of 50 kA. The red symbols are all strokes reported in the last 5 minutes, the blue strokes are those reported 5-10 minutes ago and the green strokes are those reported between 10 and 15 minutes ago. (Picture courtesy of South African Weather Service, SUMO)
While numerous test cases and examples for both the K-Index and the Lifted Index have been compiled to demonstrate this storm predictive potential of the GII results, users rose the question whether the GII retrievals were not too much driven by surface heating processes, which would in turn always produce an unstable atmosphere over an underlying warm or hot surface. The second test case shows such a situation on 31 August 2005 over Poland. This day was characterized as being a very hot summer day, but practically no clouds of convective nature ever developed during the day, as seen in the top panel of Fig. 8, which shows the MSG IR10.8 image over the area in question for 1800 UTC, i.e. at the end of the day. Correspondingly, both the K-Index and the Lifted Index for e.g. 1200 UTC indicate very stable conditions (Fig. 8, bottom panel). The Fig. also gives the corresponding values of the 1200 UTC radiosondes, which again shows good general agreement.
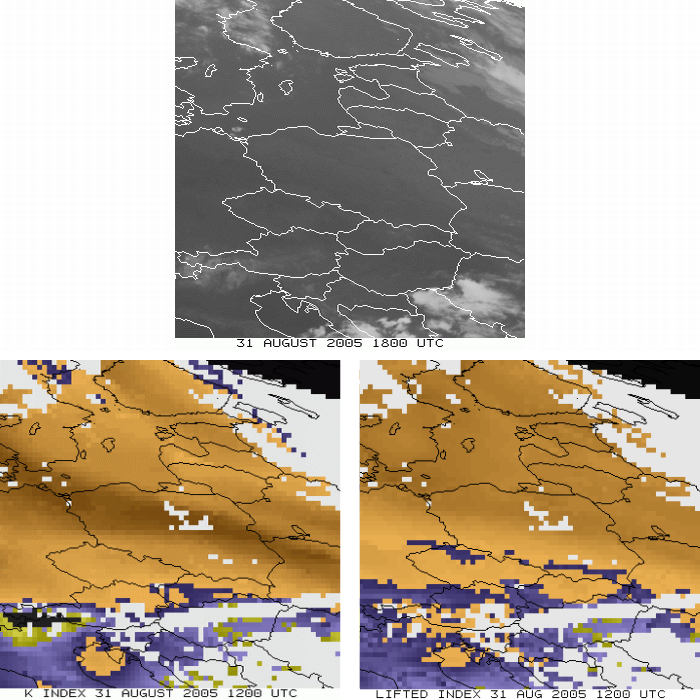
Fig. 8: K-Lindex (left) and Lifted Index (right) over Poland for 31 August 2005, 1200 UTC. The GII retrieval is done for 5 x 5 MSG pixel averages. Clouds are shown in white. Overlaid are positions of the 1200 UTC operational radio-soundings and the K-Index / Lifted Index obtained from the soundings. The top panel shows the IR10.8 image taken at 1800 UTC which shows the generally cloud free conditions that persisted throughout the entire day.
3.2. Verification Against Lightning Data over South Africa
Although the above presented test cases and examples give a good qualitative impression of the GII results, an objective and more long-term verification and assessment of the nowcast potential is difficult, as e.g. radiosondes have their obvious limitations in space and time. The South African Weather Service (SAWS) received and displayed the operational GII product since 2005 and is now in the process of incorporating it into their operational nowcast environment. Due to the high convective activity during the summer months and the high level of other technical equipment in support of severe storm nowcasting, SAWS provides an excellent test environment for a GII verification. SAWS operates twelve volume scan mode radar systems across the country. For the past few years data has also been received from MSG, and SAWS has developed its own software to display the different channels, combinations thereof as well as the Red-Green-Blue combinations. In 2005, SAWS commissioned a National Lightning Detection Network using nineteen Vaisala lightning detection sensors which provide real-time information on lightning activity associated with convective activity (Gill 2006)
In order to see how these different remote sensing tools can be used in combination to improve operational nowcasting methods in South Africa, lightning data – which is seen as an observation of real time convection – is utilized to provide a quantitative evaluation of the GII indicators. Statistics from the summer months have shown that the most frequent time for lightning occurrence is from 1100-1800 UTC. The lightning data between these times were compared to the Lifted Index and KIndex values between 0400 and 0800 UTC of the same days in order to verify the occurrence of convection together with an early warning from the GII.
Collocation of the lightning and the GII data were done within a 0.5° x 0.5° latitude/longitude box. The GII results were seen as a correct forecast of severe convection if
- More than 5 lightning strokes occurred in the box between 1100 and 1800 UTC
and
- The K-Index exceeded 35 degrees Celsius between 0400 and 0800 UTC (for the K-Index verification)
- The Lifted Index was less than –5 K between 0400 and 0800 UTC (for the Lifted Index verification)
Software developed for this purpose has the ability to visualize and compare the GII values with the occurrence of lighting strokes later in the day, as shown in Fig. 9 as an example. A calculation of statistical values such as Probability of Detection (POD), False Alarm Rate (FAR) and Accuracy are done in a quantitative manner. It should be noted that this comparison can obviously only be done over the regions covered by the lightning detection network (Fig. 10), i.e. GII values outside this area are not considered.
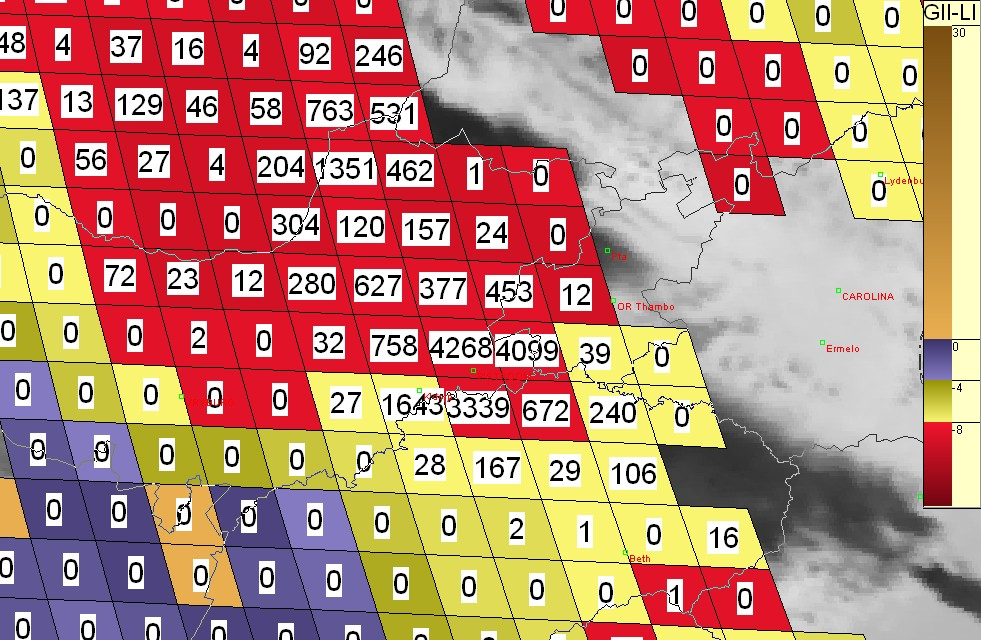
Fig 9: Lifted Index result of the operational GII over South Africa. The colors indicate the Lifted Index value according to the color bar on the right, and the actual numbers in each box are a count of the lightning strokes recorded later in the day. (Picture courtesy of South African Weather Service, SUMO)
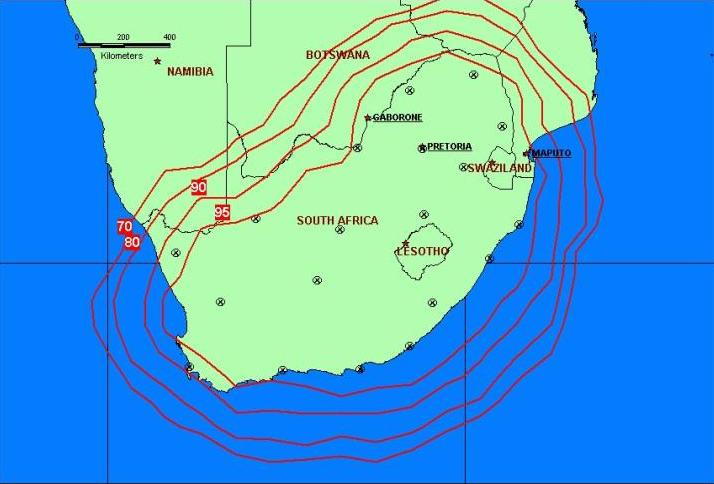
Fig 10: Overview over the South African lightning detection network: Contour lines of the detection efficiency are shown.
This verification environment was applied to a number of severe storm cases in 2006 and 2007. In order to further demonstrate the system, we will look at the case of 17 January 2006 in more detail:Early in the evening of this day a large and severe line storm developed and touched parts of the South African provinces Gauteng, Mpumalanga, and Northwest, and was moving into the greater Johannesburg area. Wind damage occurred in various places and large hail was reported. Very large advertising signboards were dislodged by the wind at Ellis Park in Johannesburg during a soccer match and players were injured. The storm dissipated rapidly north of Johannesburg as it lost its surface support, sparing Pretoria from damage.
The day started with little clouds over the country, which means that a good GII coverage could be achieved in the morning. Fig. 11 shows the GII results for the K-Index and the Lifted Index for 0600 UTC: Values of maximum instability occurred where the storm developed – over the Northwest Province and Gauteng, and the storm then moved eastwards towards Mpumalanga. The prevailing wind conditions were westerly flow, so the eastward movement could be well anticipated.
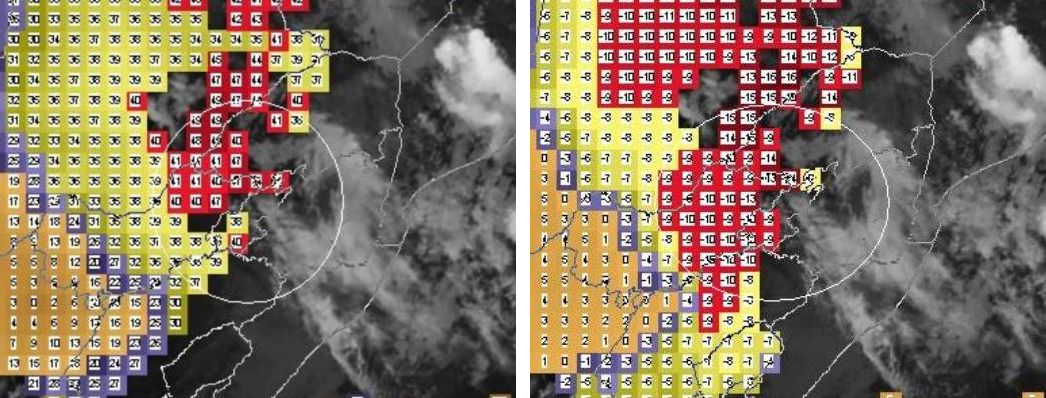 Fig. 11: K-Index (left) and Lifted Index (right) for 17 January 2007, 0600 UTC. GII results are the operational MPEF product. The circle highlights the area of interest over the Johannesburg/Pretoria region. (Picture courtesy of South African Weather Service, SUMO)
Radar reflectivities obtained at 1700 UTC show the situation for the fully developed storm (Fig. 12). Radar reflectivities of more than 50 dBz are visible in the line of thunderstorms south west of Pretoria and Johannesburg. Values of 50 dBZ or more normally are associated with heavy thunderstorms, perhaps with hail, but as with most other quantities, there are no reliable threshold values to confirm the presence of hail or severe weather in a given situation (Branick 2006).
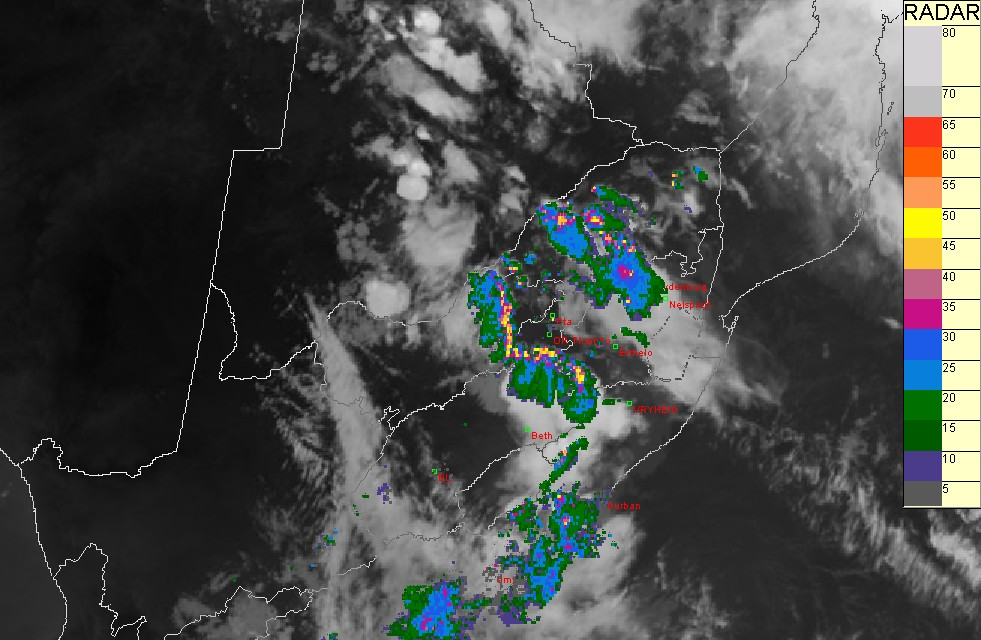
Fig. 12: Composite of the MSG IR10.8 image and radar reflectivities for 1700 UTC show the fully developed storm.
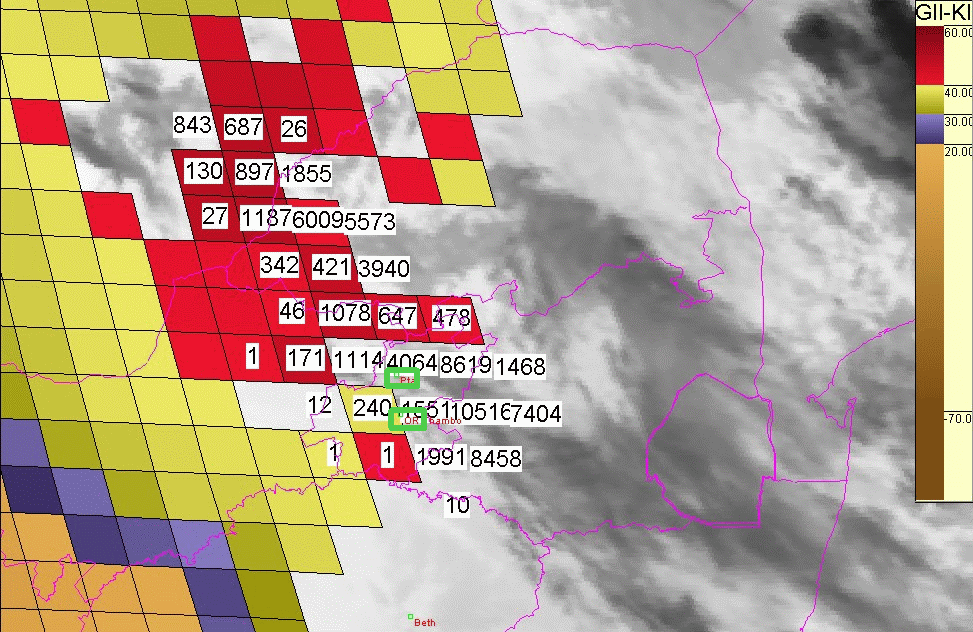
Fig. 13: K-Index Index result of the operational GII over South Africa, for 17 January 2007, 0600 UTC. The colours indicate the K-Index value according to the color bar on the right, and the actual numbers in each box are a count of the lightning strokes recorded later in the day. For reference, Pretoria and Johannesburg are marked by green rectangles just south of the image center.
Although the radar reflectivities by themselves qualitatively verify the early morning GII results as being a good storm indicator, the quantitative comparison was done against the lightning data (Fig. 13). The results of the evaluations of the early morning K-Index and the Lifted Index against the midday and afternoon lightning occurrences are shown in Table 3. “Accuracy”” is here defined as
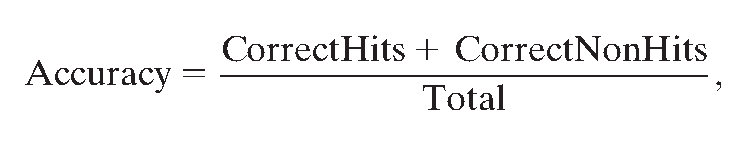
where the CorrectHits is the number of correctly forecasted storm occurrences according to the above index and lightning criteria, and the CorrectNonHits is the number of correctly forecasted no-storm conditions, i.e. where none of the above criteria were met.
| GII Index | Probability of Detection (POD) | False Alarm Rate (FAR) | Accuracy |
| K-Index | 0.73 | 0.33 | 0.70 |
| Lifted Index | 0.79 | 0.28 | 0.75 |
Table 3: GII verification results for the 17 January 2007 case
Using this verification system for five cases in the storm season 2006/2007, we get POD, FAR and Accuracy values as shown in Table 4.
| GII Index | Probability of Detection (POD) | False Alarm Rate (FAR) | Accuracy |
| K-Index | 0.77 | 0.33 | 0.70 |
| Lifted Index | 0.84 | 0.36 | 0.68 |
Table 4: GII verification results for five cases in the convective season 2006/2007
In summary, we see fairly high values for POD, together with low False Alarm Rates over South Africa. These findings encourage forecasters to focus their attention on a specific area early in the morning and then watch the convective development more closely with radar as time progresses. As mentioned above, the MPEF operational GII product uses the forecast fields from the ECMWF model with a 1 deg latitude/longitude horizontal resolution. A local version of the GII code has recently been installed at SAWS which uses a local mesoscale model (the local version of the Met Office’s Unified Model) with a 0.1 degree latitude/longitude resolution. It is now also possible to calculate the values for a 3 x 3 MSG pixel block, replacing the coarser 15 x 15 pixels processing areas of the MPEF product. Ongoing verification will be done in the coming summer months to show whether the improved resolution will be of further benefit to the already positive results.
4. Summary and Outlook
MSG offers the great opportunity to derive air mass parameters as instability indices and total precipitable water from the measurements in the infrared spectrum. As MSG SEVIRI is far from being an instrument with full sounding capabilities like modern hyperspectral sounders, a detailed temperature and humidity profile, taken from a global or local forecast model, is needed as a first guess or background field for the retrieval. It was shown that the MSG measurements actually add information over the forecast in terms of local extremes and gradients.
Numerous test cases and the more quantitative verification process that was initiated by the South African Weather Service show the generally good warning potential of the derived instability fields. Of high value here is the added capability of a continuous monitoring of the instability fields that is guaranteed by MSG’s 15 minute repeat cycle. Over time, a better spatial coverage can be achieved – as the chance of finding a cloud free area for the retrieval process increases, and the evolution of instability over time can be studied. A full evaluation of this latter aspect still needs to be done and will be the subject of future work.
The current EUMETSAT GII product is aimed at helping a forecaster to turn his attention to a certain region, which he can then monitor more closely with other means like satellite imagery and radar data over the next hours. The MSG GII data have proven to provide lead times between 6 to 9 hours. Within a fully developed convection nowcasting system, the GII can provide a first level of warning, usually covering a larger area. When time progresses, other satellite derived parameters like cloud coverage, cloud top cooling and growth rates, together with the development of microphysical parameters, will then help to further indicate the exact location of the severest parts of the clouds (Mecikalksi and Bedka 2006, Rosenfeld and Lensky 2006). These satellite derived convection products are shown to still have some lead time over radar observations, i.e. are even useful when good radar coverage is available, but will be especially beneficial for areas without any radar information. This is of special importance for large parts of Africa, where the availability of radar is extremely limited. Providing useful nowcasting tools for use in African countries thus relies on
satellite and numerical weather prediction model output. MSG with its spectral, spatial and temporal resolution provides an ideal platform for the development and testing of such an automated system of a series of warning levels.
With respect to the GII product itself, the impact of the product resolution and the resolution of the underlying model are current areas of research between EUMETSAT and SAWS, where the above mentioned local GII installation at SAWS plays a crucial role. South Africa also acts as a vehicle to the rest of Africa to provide forecasting and nowcasting tools. Through this product and the SUMO display system – which can be downloaded from the internet free of charge – to display it, African countries have access to tools to aid in their nowcasting procedures as well.
5. References
Branick, M, 2006: A Comprehensive Glossary of Weather Terms for StormSpotters. NOAA Technical Memorandum NWS SR-145, NOAA/NWS/WFO Norman, http://www.la.utexas.edu/users/kimmel/NWS-SR145.pdf
Chevallier, F., 2002: Sampled databases of 60-level atmospheric profiles from the ECMWF analyses. NPWSAF-EC-TR004.
Dostalek, J.F., and T.J Schmit, 2001: Total precipitable water measurements from GOES sounder derived product imagery. Wea. Forecasting, 16, 573-587.
Eyre, J.R., 1991: A fast radiative transfer model for satellite sounding systems. ECMWF Technical Memorandum No. 176, 28pp.
Fuhrhop, R., A. Erdmann, H. Czekala, and C. Simmer, 2000: Development of operational algorithms for the retrieval of instability indices from MSG. Final Report of EUMETSAT Contract No. EUM/CO/98/646/JKK, 147 pp.
Galway, J.G., 1956: The lifted index as a predictor of latent instability. Bull. Amer. Met. Soc., 37, 528-529.
Gill, T., 2006: Preliminary Results from the South African Weather Service Lightning Detection Network, SASAS Conference 2006, Maselspoort, Bloemfontein, South Africa, 4-6 October 2006.
Hayden, C.M., 1988: GOES-VAS simultaneous temperature-moisture retrieval algorithm. J. Appl. Meteor., 27, 705-733.
Kitzmiller, D.H. and W.E. McGovern, 1989: VAS retrievals as a source of information for convective weather forecasts: An objective assessment and comparison with other sources of upper-air observations. Mon. Wea. Rev., 117, 2095-2109.
Kurz, M., 1993: Severe thunderstorms over western Germany – a case-study of the weather situation on 20 August 1992. Meteorol. Mag., 122, 177-188.
Lutz, H.-J., 2007: Cloud detection from MSG – algorithm theoretical basis document. EUMETSAT document EUM/MET/REP/07/0132.
Ma, X.L., T.J. Schmit, W.L. Smith, 1999: A nonlinear physical retrieval algorithm – its application to the GOES-8/9 sounder. J. Appl. Meteor., 38, 501-513.
Malan, D. and N. Kroese, 2006: SUMO. In: Report of the seventh EUMETSAT User Forum in Africa, EUM P.49, ISBN 92-9110-077-3, ISSN 1024-8587.
Mecikalksi, J.R. and K.M. Bedka, 2006: Forecasting convective initiation by monitoring the evolution of moving cumulus in daytime GOES imagery. Mon. Wea. Rev., 134, 49-78.
Menzel, W.P., F.C. Holt, T.J. Schmit, R.M. Aune, A.J. Schreiner, G.S. Wade, and D.G. Gray, 1998: Application of GOES8/9 soundings to weather forecasting and nowcasting. Bull. Amer. Met. Soc., 79, 2059-2077.
Peppler, R.A., 1988: A review of static stability indices and related thermodynamic parameters. SWS Misc. Publ. 104, Illinois State Water Survey Division, Climate and Meteorology Section. 94 pp. 17
Rao, P.A. and H.E. Fuelberg, 1997: Diagnosing convective instability from GOES-8 radiances. J. Appl. Meteor., 36, 350-364.
Rodgers, C.D., 1976: Retrieval of atmospheric temperature and composition from remote measurements of thermal radiation. Rev. Geophys. Spac. Phys., 14, 609-624.
Rosenfeld, D. and I. Lensky, 2006: The time-space exchangeability of satellite retrieved relations between cloud top temperature and particle effective radius. Atmos. Chem. Phys. Discuss., 5., 11911- 11926.
Saunders, R., M. Matricardi, and P. Brunel, 1999: An improved fast radiative transfer model for assimilation of satellite radiances observations. Q J. R.. Meteorol. Soc., 125, 1407-1425
Schmetz, J., P. Pili, S. Tjemkes, D. Just, J. Kerkmann, S. Rota, and A. Ratier, 2002: An introduction to Meteosat Second generation (MSG). Bull. Amer. Met. Soc., 83, 977-992.
Seeman, S.W., E.E. Borbar, R.O. Knuteson, G.R. Stephenson, H.-L. Huang, 2007: Development of a global infrared land surface emissivity database for application to clear sky sounding retrievals from multi-spectral satellite radiance measurements. Accepted for publication in J. Appl. Meteor. Clim.
Setvák M. and R.M. Rabin, 2005: MSG observations of deep convective storms. In: The 2005 EUMETSAT Meteorological Satellite Conference, Dubrovnik, Croatia. EUMETSAT P.46, ISBN 92-9110-073-0, ISSN 1011-3932, 460-466.