
IR brightness temperature color enhancement, recommended for tops of deep convective clouds
Martin Setvak (CHMI) and Daniel Lindsey (NOAA/CIRA)

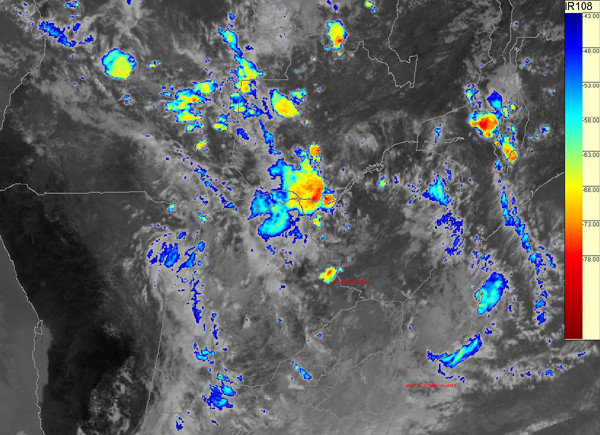
While the non-enhanced black and white image on the left shows almost no detail in the storm-top thermal structure, the color-enhanced image on the right brings out details of the brightness temperature (BT) structure of the storm tops.
The enhancement of a particular BT range can be accomplished by using either a grey scale or a color scale. While the grey-scale-based enhancement was typical in the early years of satellite meteorology (1960’s and 70’s), with advances in computer technology the color enhancement began to dominate. The reason for favoring the color enhancement is simple – the human eye, when examining a certain BT interval, can resolve significantly more individual colors than a corresponding number of grey shades.
There are many ways in which such a color enhancement can be defined – varying namely by the color scheme (assignment of the individual colors to certain brightness temperatures) and by the BT range to which the enhancement is applied. Some enhancements use a “step scale” applying a set of colors to smaller BT intervals (in other words, the range of BT selected for enhancement is divided into smaller intervals, and each of these intervals is represented by a certain constant color); a disadvantage of this type of enhancement is that some of the fine details of the cloud top structure may remain hidden or unresolved. The color enhancement shown above uses a continuous color scale, where every individual BT resolved by the satellite (within the selected BT range) is represented by a unique color.
In the past, almost every weather service or group of scientists has used its own color scheme, with little or no “standardization” among groups. This sometimes resulted in problems when sharing the products with others,particularly at various training activities. It required “ingesting” the color scheme (color palette) first, before starting to interpret the color-enhanced images. In order to simplify this situation, at the first CWG meeting at Krakow, the group agreed to unify on a certain color scheme, which has since been recommended as the “standard” one, and which is now being used by many European weather services for their operational products.
This “standardization” does not necessarily imply that the exact same color scheme is being used by everyone; it just defines the order of colors used from the warm to the cold end of the interval over which the enhancement is applied. In general, blue colors should be used for the warm end of the interval, and red colors for the cold end. The main reason for choosing this order of colors is the fact that a human brain usually associates red with “danger”, or something very important. In the case of convective storms the most important features are those which appear coldest (e.g. the overshooting tops), hence the red assignment to these.
The practical implementation of the recommended color scheme depends on the two factors listed below:
- Geographical region – the closer to the tropics you are, the lower the typical temperatures of deep convective clouds. This means that for most of Europe the optimal range for BT color enhancement is about 200-240 K, but closer to the equator you may find something like 180-220 K more useful. Besides the geographical latitude, another factor to consider is the height and temperature of the tropopause. However, for operational applications it is probably more practical to select an optimal range for your region and maintain the color enhancement regardless of the synoptic situation, throughout the year. For examples of how the appearance of a storm top changes as you modify the enhancement thresholds, see the 16 January 2008 “Maputo case” in the CWG Case Studies.
- The software used to process and visualize your satellite data. The method chosen to implement the color palette strongly depends on the system manufacturer and/or the software behind it. Some systems demand a detailed look-up-table between the individual BTs and RGB components, others can use internal pre-defined palettes (only matching those to the selected BT range), and for some of the systems you can simply load the color palettes prepared by someone else. Below you will find a collection of color palettes for various systems; if your system is not listed here and you manage to modify the palette to be used with it, please share it with the others here…
Downloads:
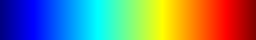
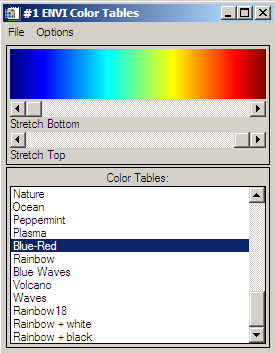
Source of the “standard” color palette (shown above). The text file gives the red, green and blue (RGB) components, from the warm (blue) to the cold (red) end of the palette. This palette (or similar) is used by many remote-sensing software packages; this one was implemented from IDL/ENVI where it is built-in as a standard ENVI “Blue-Red” color table. You can use this text file to create your own color enhancement palette.
VCS Space: VCS 2met! system 200-240K color table (zip file) If you are using a 2met! system from VCS Space or their Vision+ software, you can download this color table, unzip it, drop it into the color tables folder, and start using it for the IR10.8 (or any other IR-window band) calibrated images (XPIF files).
McIDAS: McIDAS 200-240K enhancement files (zip file, provided by Marianne Koenig). 200-240K color enhancement table (CLOUDTOP.ET) and corresponding strech table (CLOUDTOP.ST) files for the McIDAS software. SUMO: color enhancement table
The 190-230K color enhancement table was developed by SAWS for SUMO visualisation software.