
Sandwich product: blending the HRV and IR10.8 BT imagery
Martin Setvák (CHMI), Lukáš Ronge (Amateur Stormchasing Society of the Czech Republic), Ján Kaňák (SHMI)
The overshooting tops usually resemble “bubbles” of several image pixels across, seen either in visible and near infrared spectral bands due to their texture and shadows they cast, or in thermal bands as local brightness temperature minima, with steep gradients surrounding them. Under favorable conditions the overshooting tops are accompanied by smaller-scale warm spots or larger and longer-lived embedded warm areas, forming downwind of the overshooting tops, easily observed in the color-enhanced thermal IR imagery. Usually the overshooting tops and their downwind warm spots are observed independently, in the two stand-alone bands – the HRV band, and color-enhanced IR10.8 brightness temperature imagery. Here we present a new image product, which merges the two bands together, allowing to observe all of these features simultaneously, in one single product.
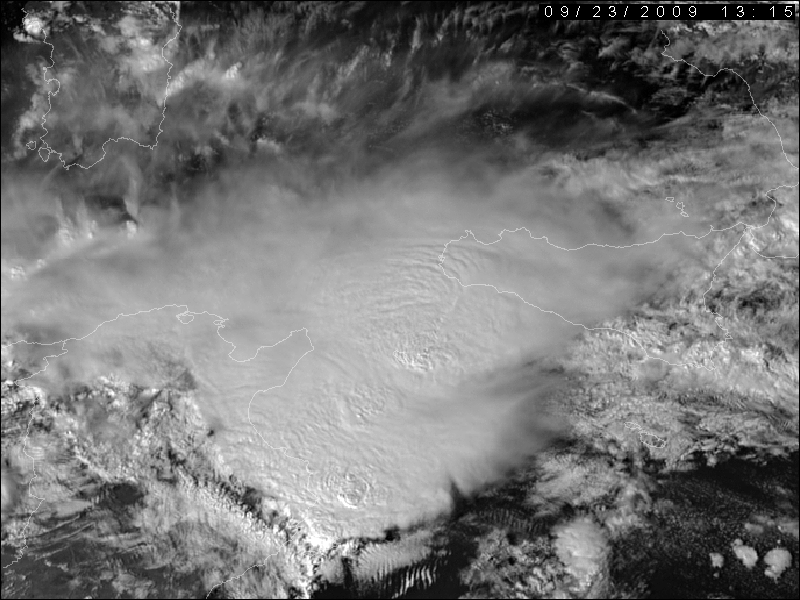
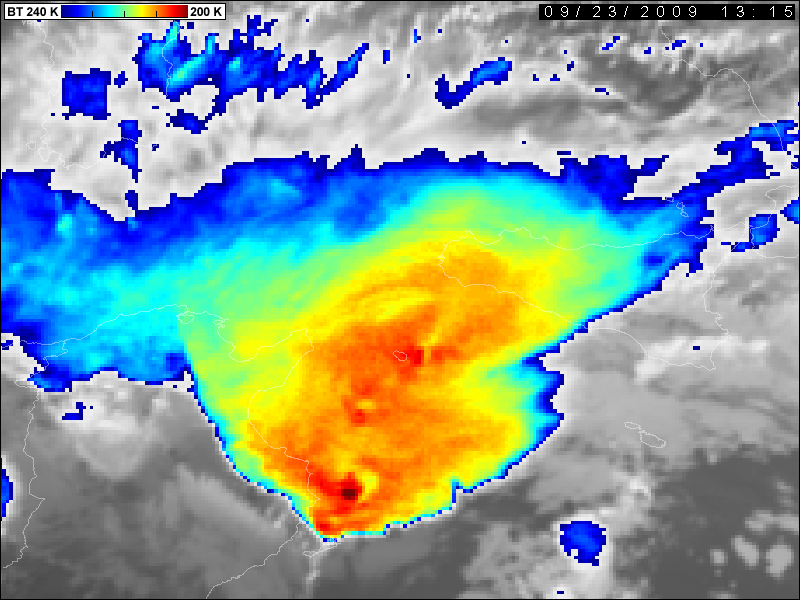
The product consists of two layers: the background one, which is the High Resolution Visible (HRV) image, and the upper layer, containing the color-enhanced IR 10.8 image, showing the details of the brightness temperature field (above).
Next, there are several options how to “blend” these two layers together. The simplest way is to use just the partial transparency of the upper layer, setting the layer opacity somewhere between 40 to 80%. Somewhat better results can be obtained by using some other type of “blending” of the two layers together – for example in the Adobe Photoshop you can try either the “Multiply” or “Linear Burn” functions (in “Blending Options”), again in combination with the layer opacity set as above. Of course, the background HRV image can be enhanced first by some of the standard procedures, for example using the “Unsharp Mask” filter. The example below shows the two images from above, merged together in Photoshop, using the “Multiply” blending and 80% opacity:
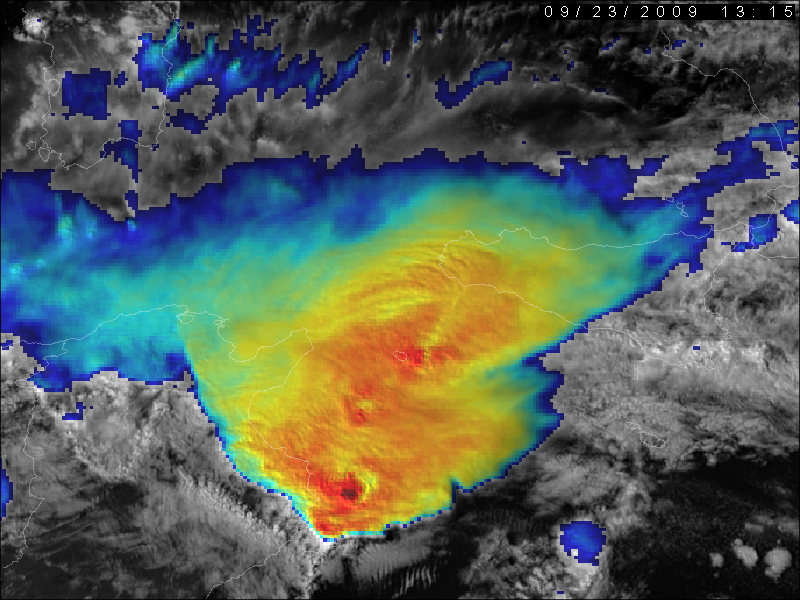
Images as this one can quickly show the relative position of features seen in the visible bands (not only the overshooting tops, but also various cloud-top waves and plumes) and features observed in the thermal bands. Similar products can be generated automatically, e.g. using the Image Magick software.
This blended product becomes even more attractive when used in loops of satellite imagery. Below you can find examples of such movie files for two cases: the storms from above (23 September 2009), and storms from 31 May 2008. For both cases we show the original, single band loops (HRV and IR108-BT), and the loop of blended images (HRV_IR108-BT). The original images were obtained in the Rapid Scan Service, at 5 minute intervals.
For additional details and more examples see this material.
23 September 2009 (between Tunesia and Sicily)
- HRV loop – MPG file (9.5 MB)
- IR108-BT loop – MPG file(9.8 MB)
- blended HRV_IR108-BT loop – MPG file (9.3 MB)
Additional information for this case (together with example of this product generated in Image Magick) can be found here.
31 May 2008 (east Germany, west Czech Republic)
- HRV loop – MPG file (7.9 MB)
- IR108-BT loop – MPG file (11.3 MB)
- blended HRV_IR108-BT loop – MPG file (8.2 MB)